In the last two posts in this series, we showed what an agent can do when nobody is watching: open a tunnel to a laptop in 37 seconds, hand out an unauthenticated shell in 20. This post is the other half. What does it look like when someone is watching?
The question nobody can answer
Ask most security teams a simple question: how many AI coding agents are running against your codebase right now, and what have they touched? Most can't answer it. Not because the agents are hidden, but because nothing in the existing stack was built to watch a prompt turn into a shell command, a shell command turn into a file write, a file write turn into a deploy.
We built KonaSense's Agent Control Plane to answer that question directly. Here's what that looks like on a live account.
Agent execution traces, at the org level
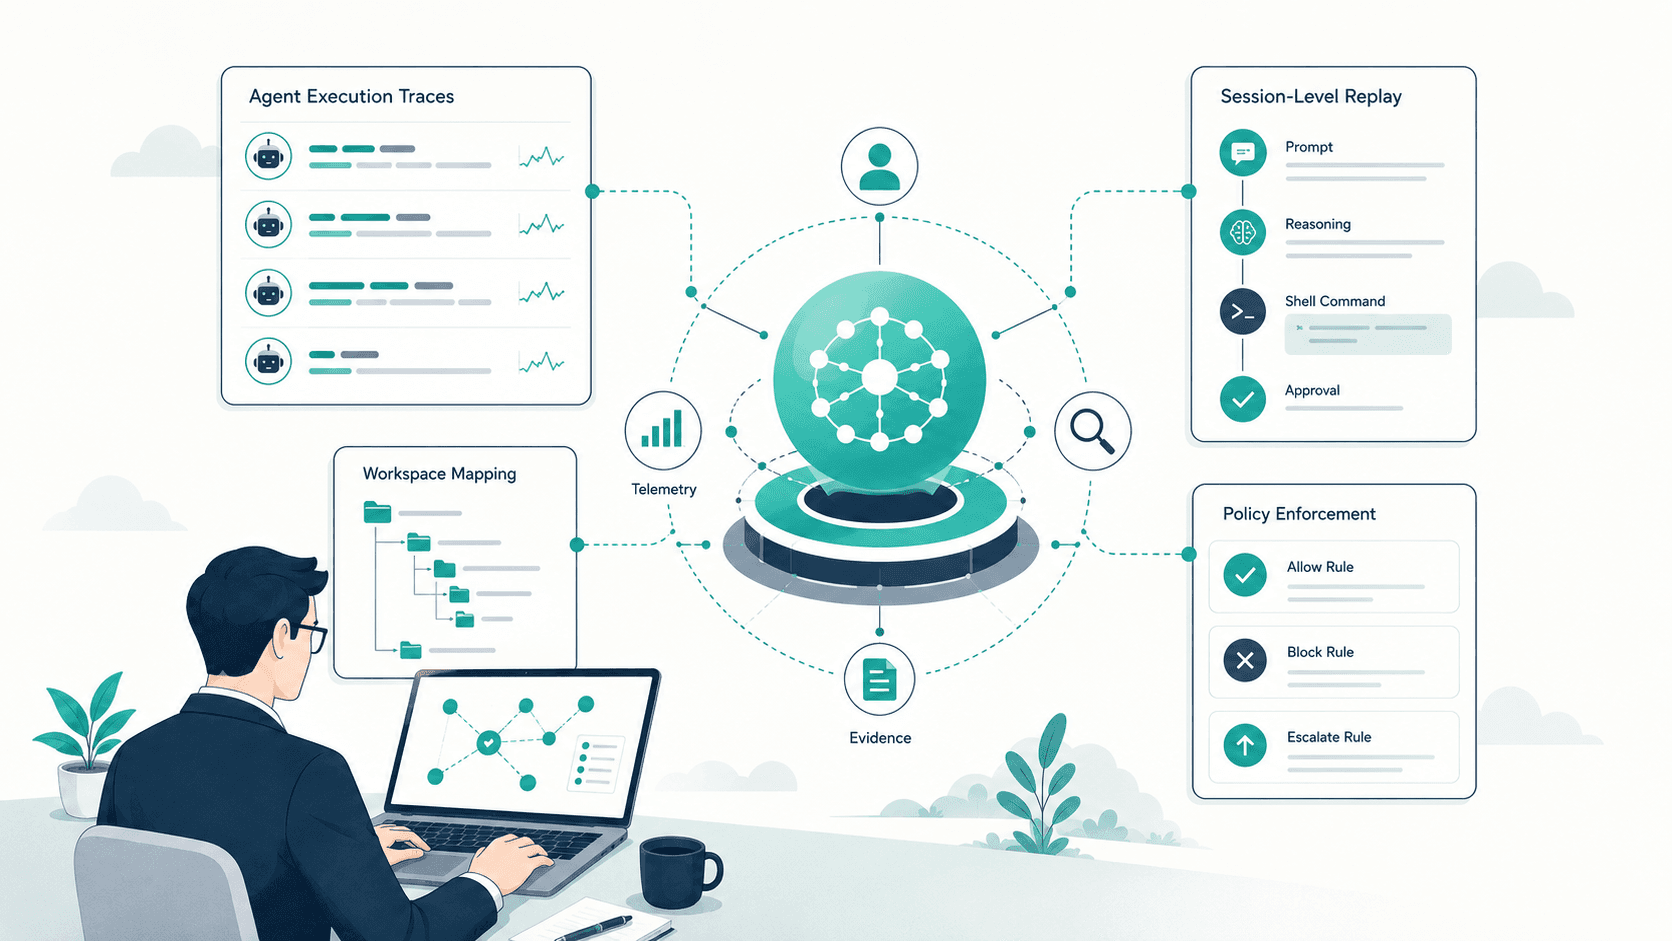
The first view is a roll-up: every agent seen across the org, which provider it's running through, and how much it's actually doing.
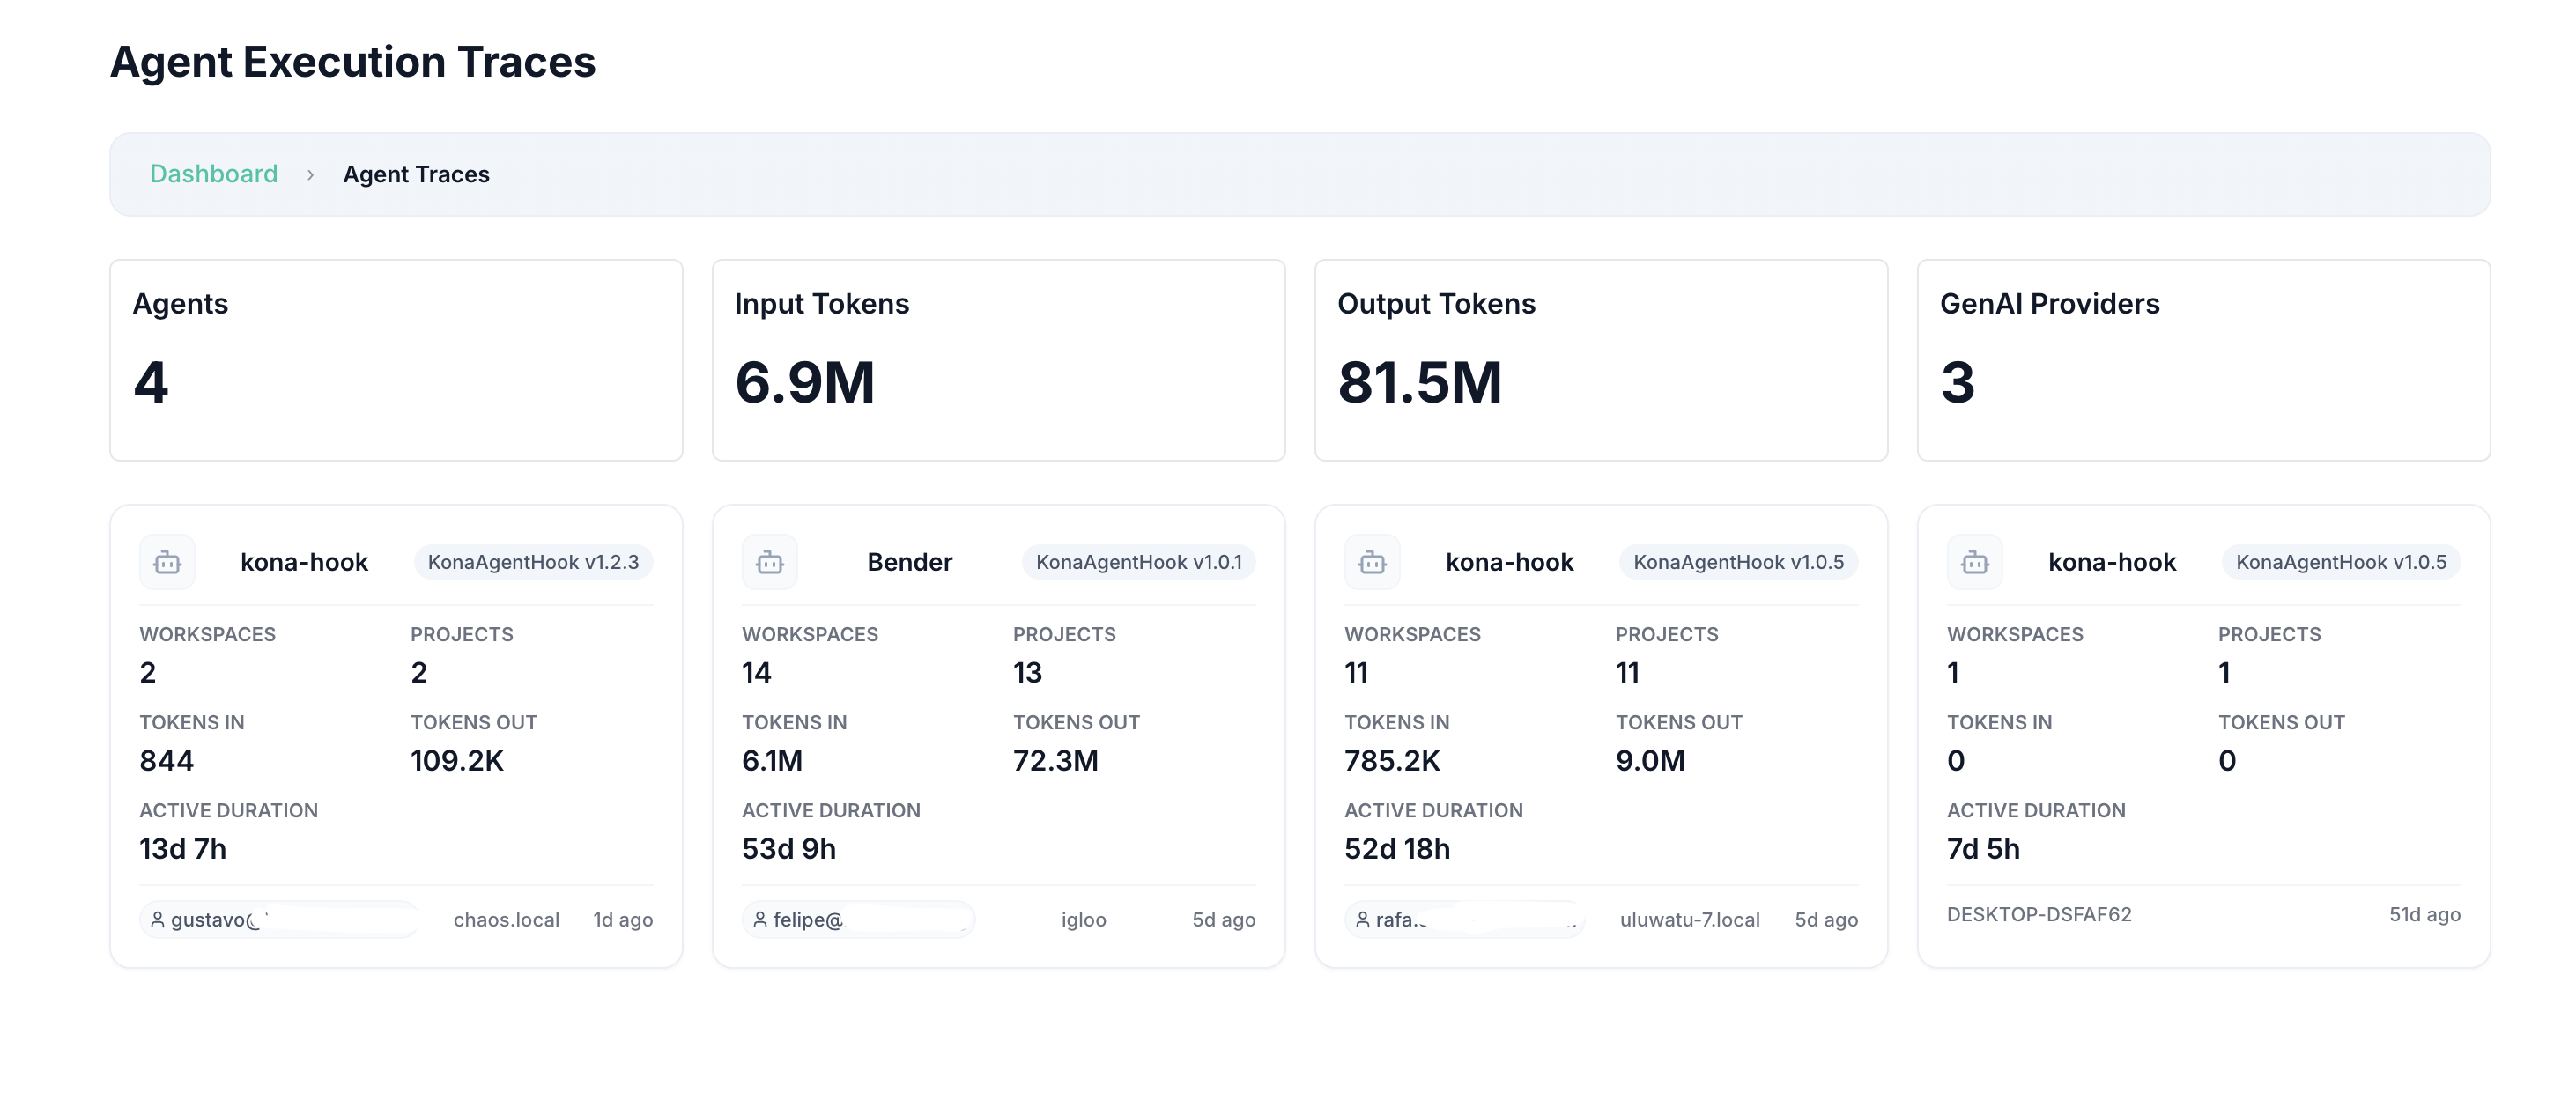
That last part matters more than it sounds. Every agent instance on this dashboard is tied to a person: an email address, not just a hostname. When an agent runs, you know whose credentials it's running under, not just that "an agent ran somewhere."
Per-agent depth
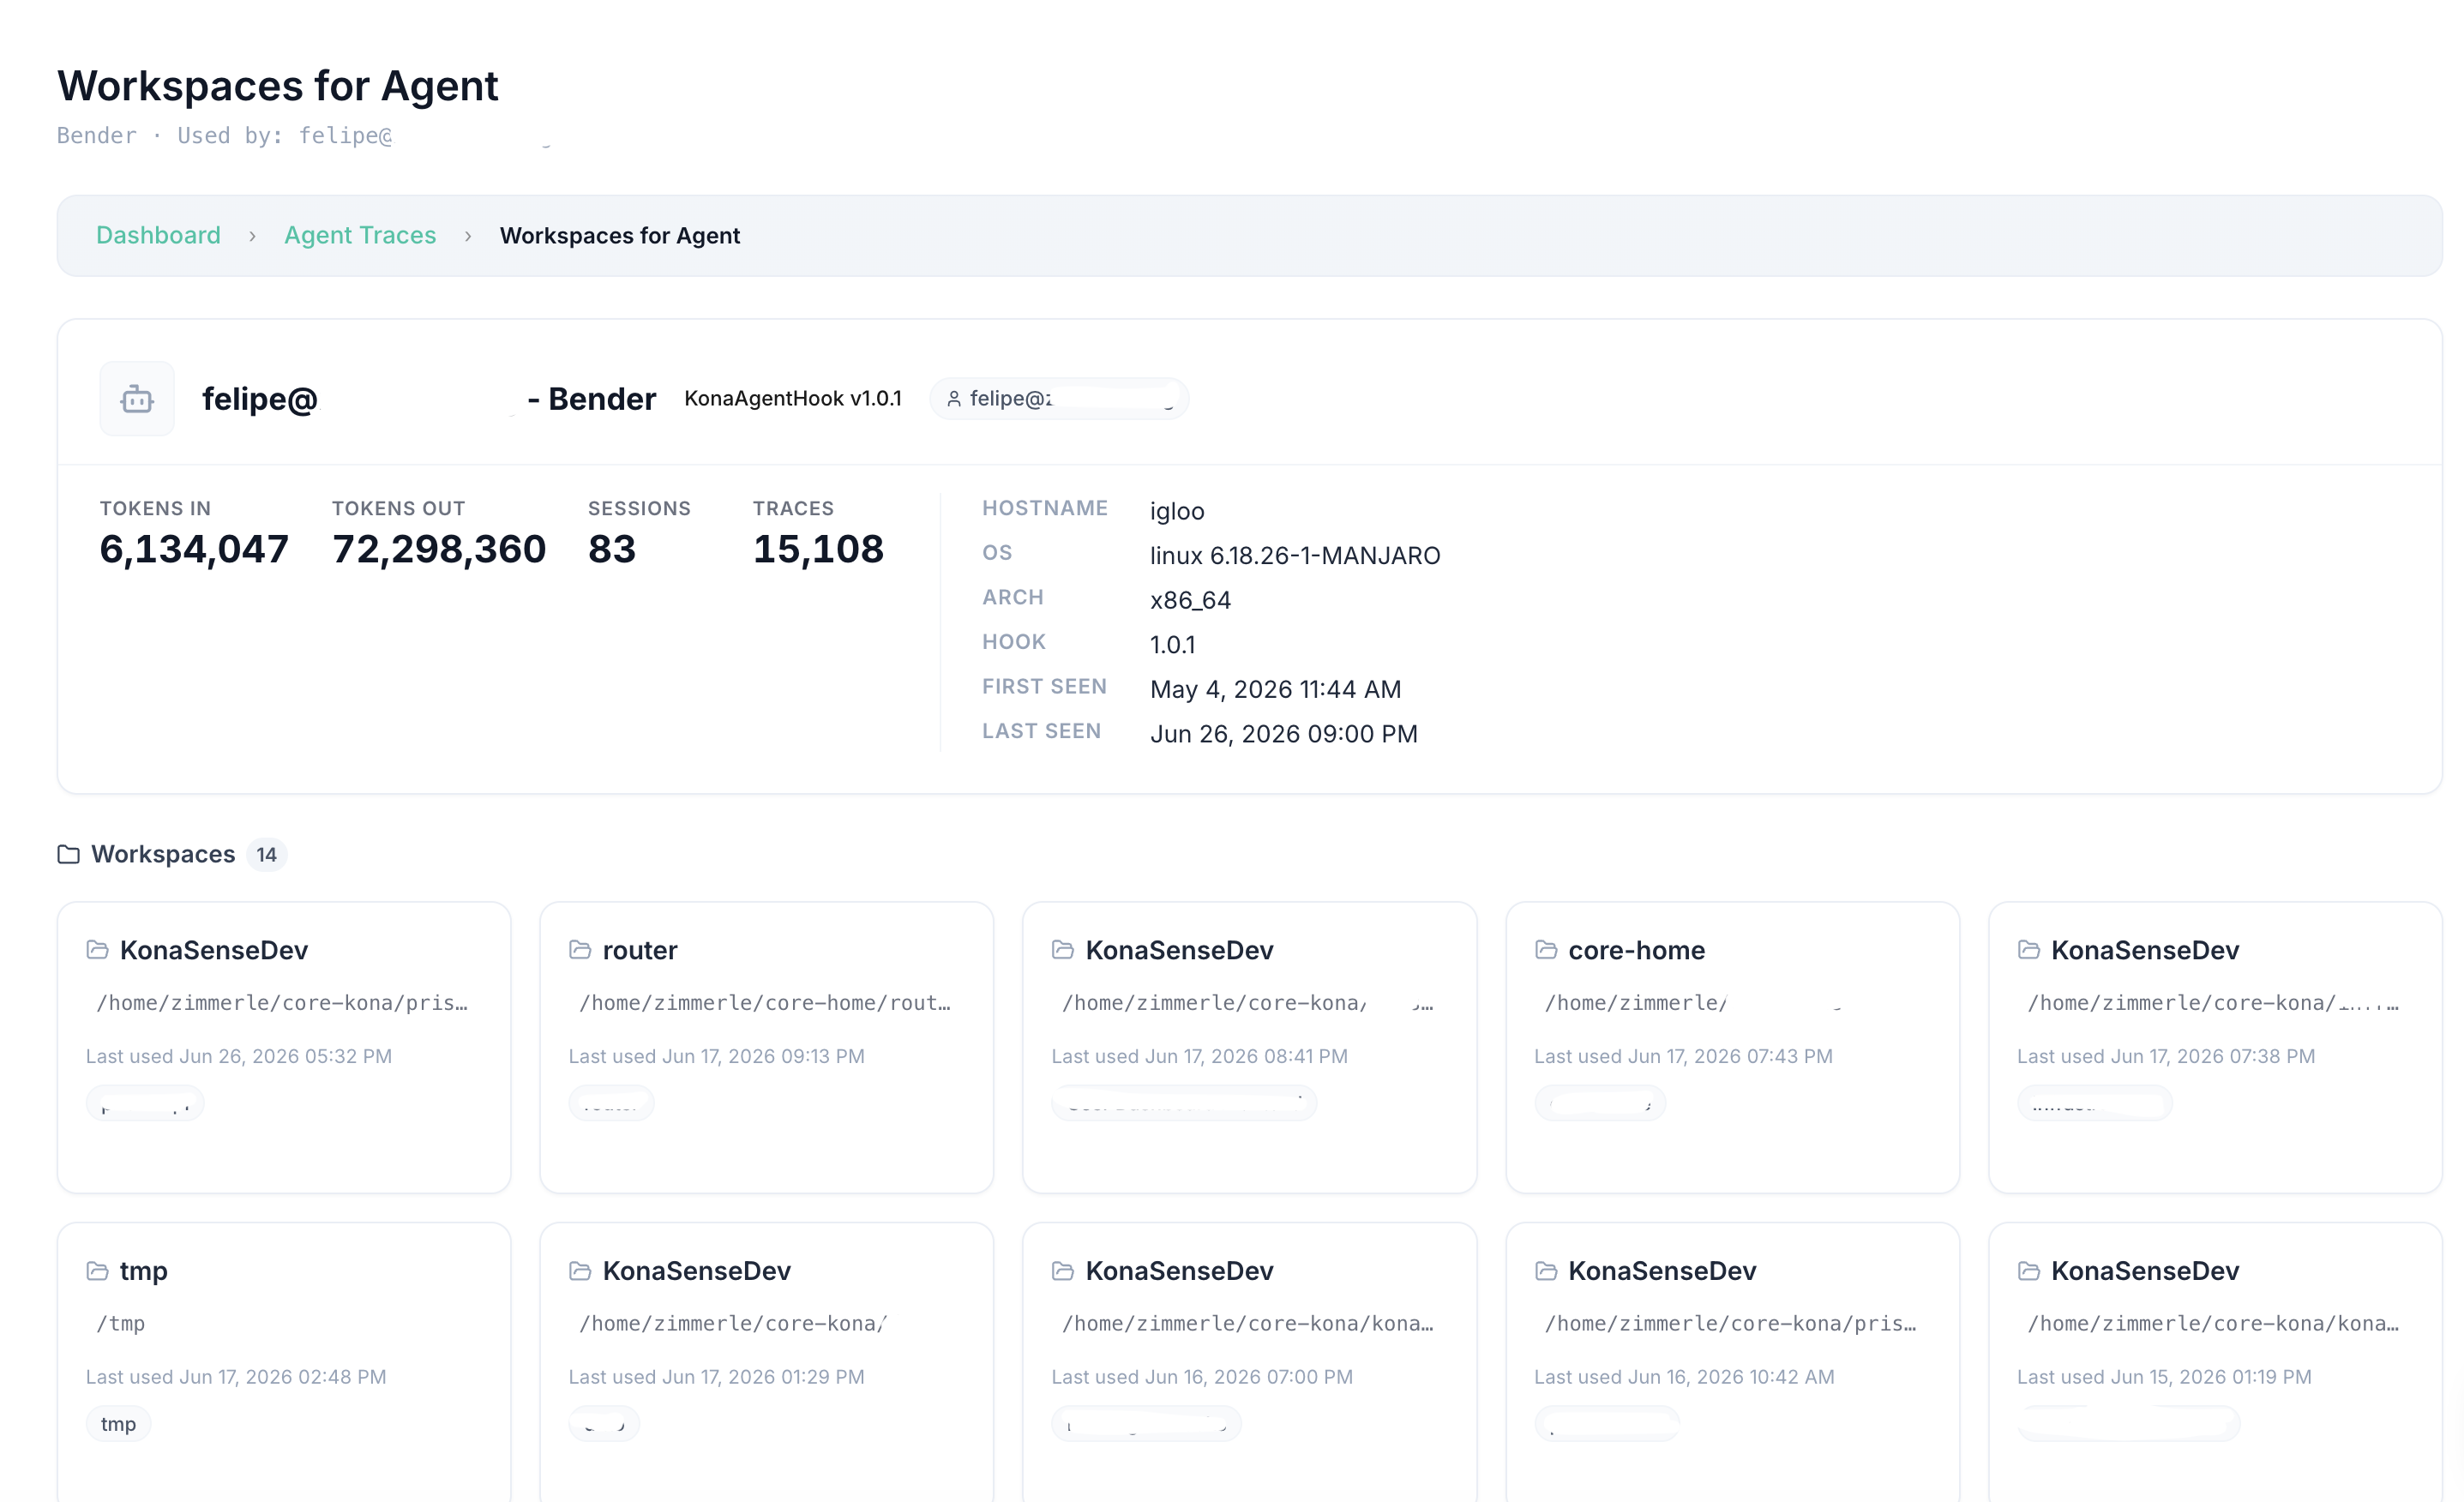
Click into a single agent and the rollup becomes a full profile. One agent on this account, running against 14 workspaces and 13 projects, shows 6.1M input tokens and 72.3M output tokens, across 83 sessions and 15,108 individual traces, with 53 days of cumulative active duration. The profile also carries the machine-level fingerprint: hostname, OS and kernel version, architecture, hook version, first-seen and last-seen timestamps.
Session-level replay
Rollups tell you scale. They don't tell you what happened in any one session. For that, KonaSense keeps a full replay: the original human prompt, every shell command the agent ran in response, the agent's own stated reasoning between steps, and whether the session required a policy decision.
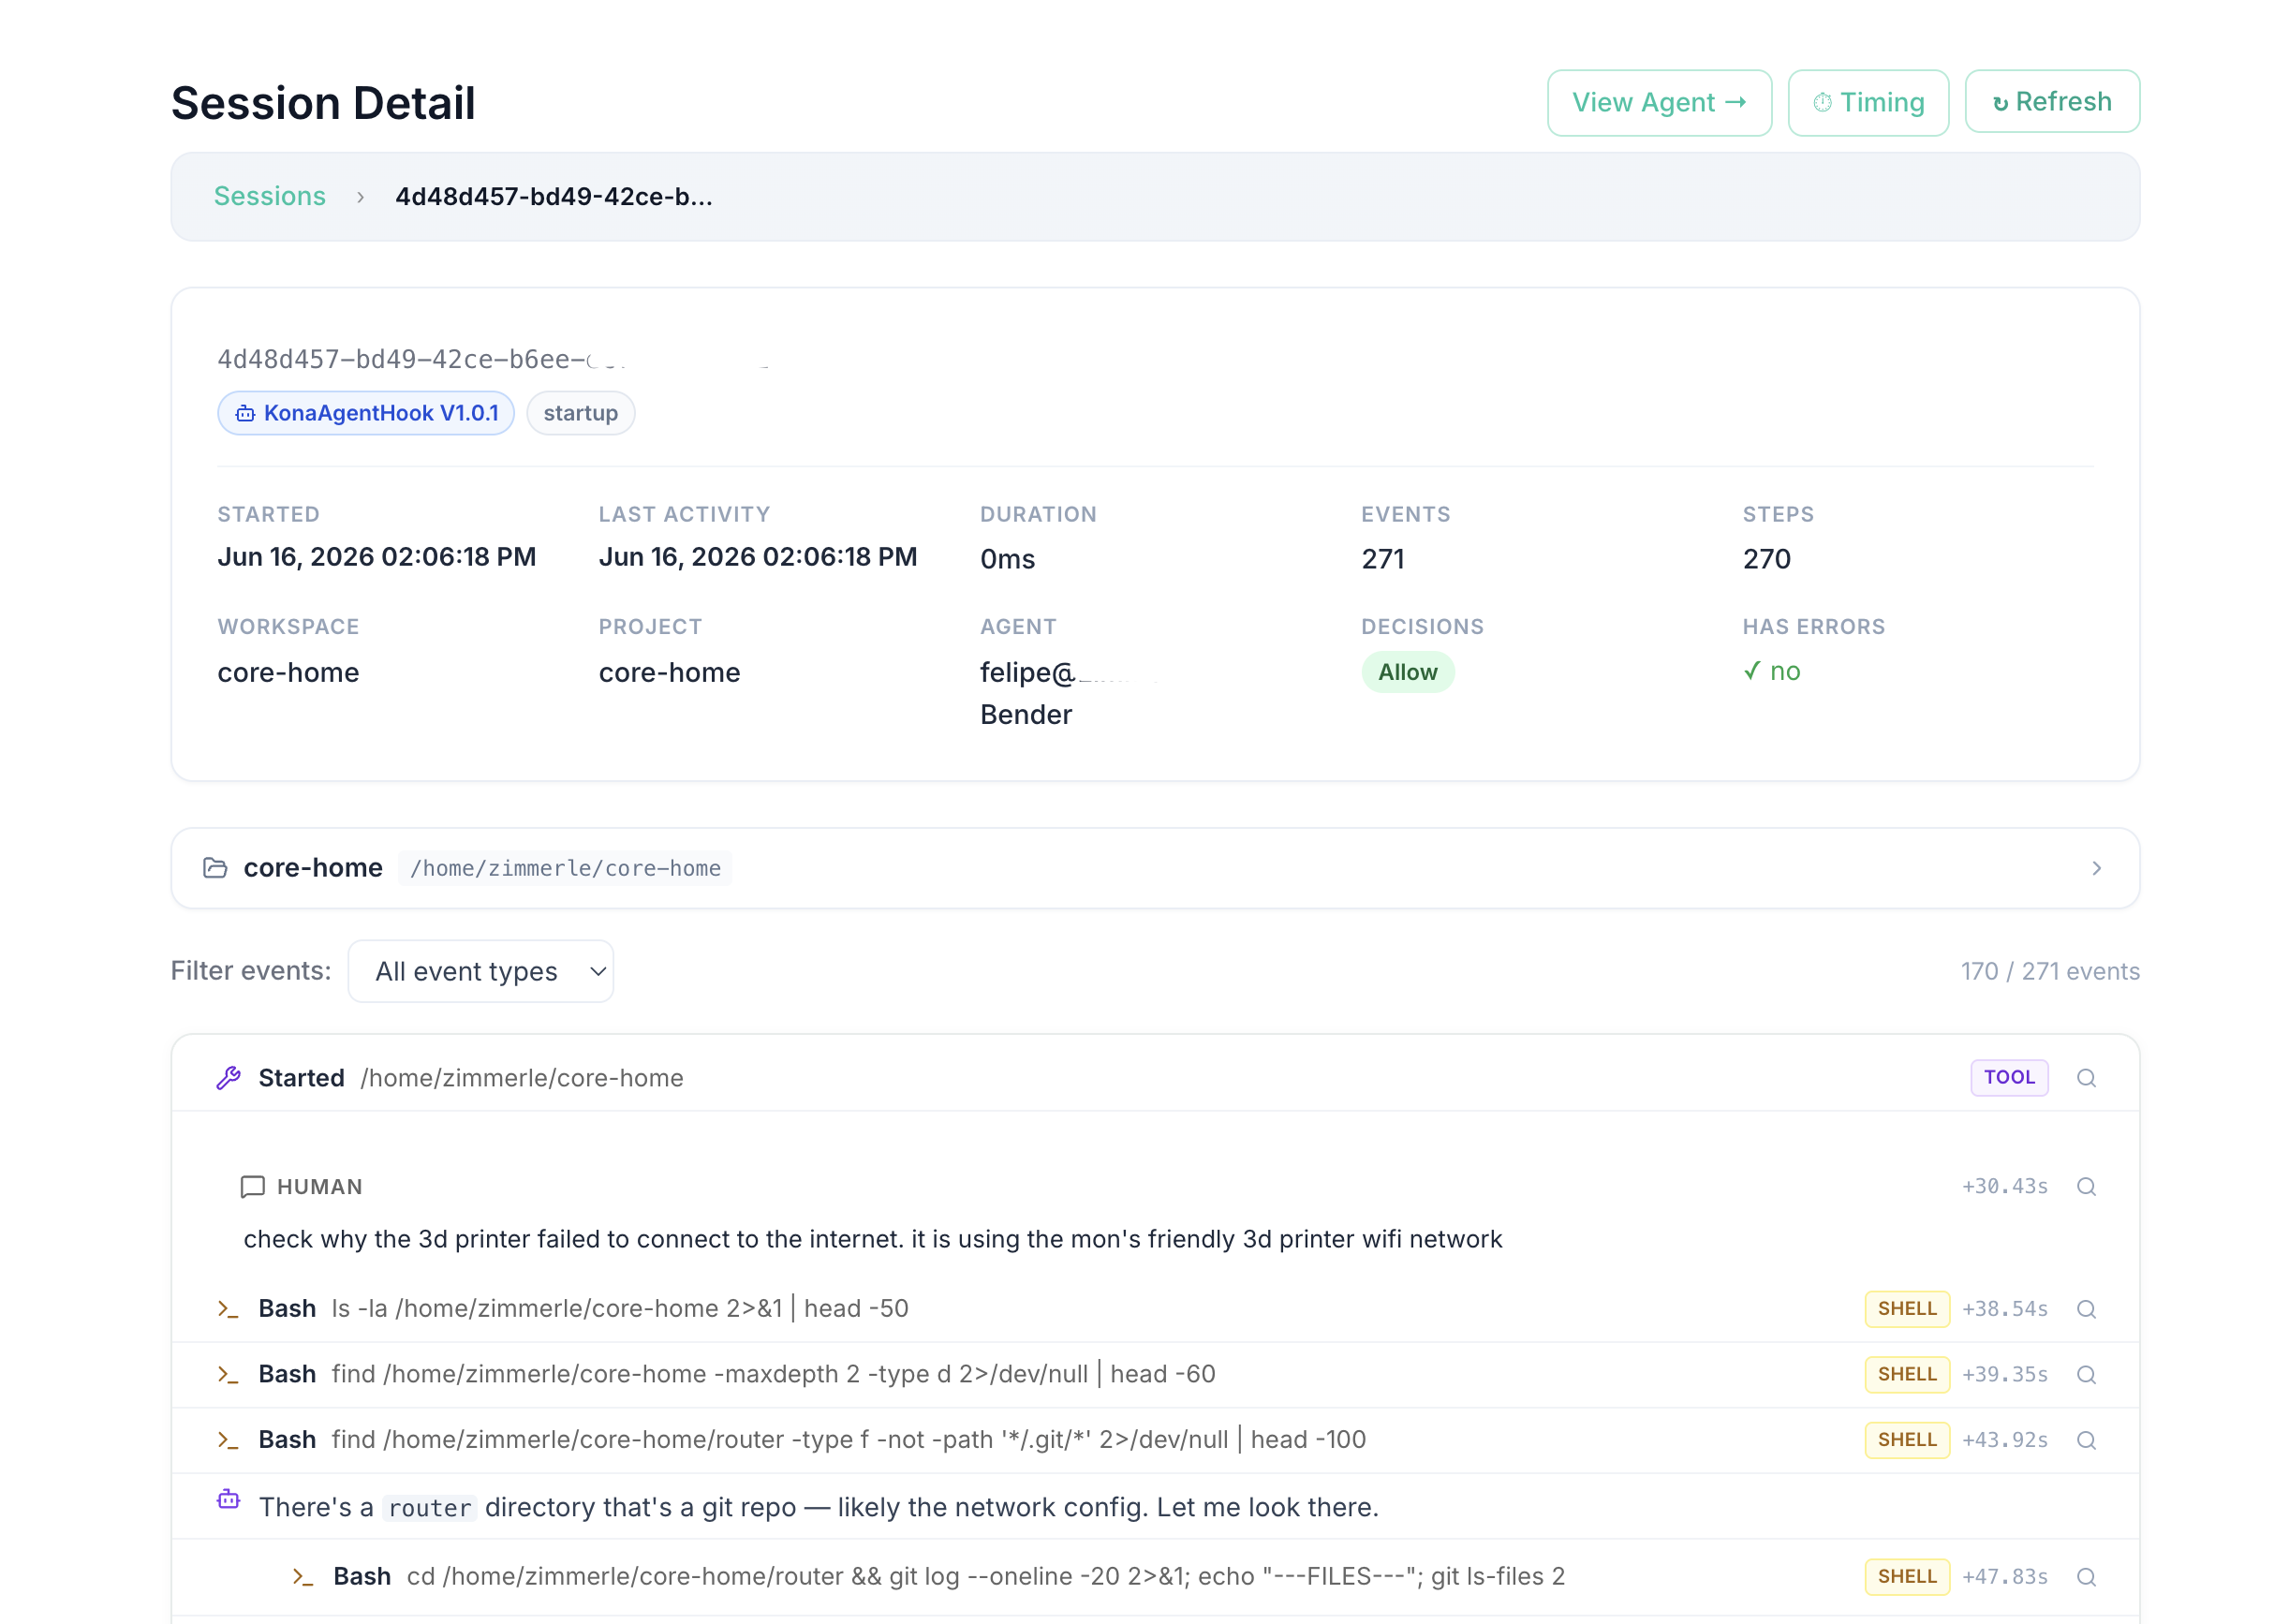
This is the piece most monitoring stacks don't have an equivalent for. A network log tells you a connection happened. An endpoint agent tells you a process ran. Neither tells you why, in the agent's own words, or what the human actually asked for that set the chain of commands in motion. The session trace does.
Workspace mapping
Zoom back out and KonaSense maps every workspace every agent has touched, across the whole org: which directory, which project, which language and dependency count, and when it was last used.
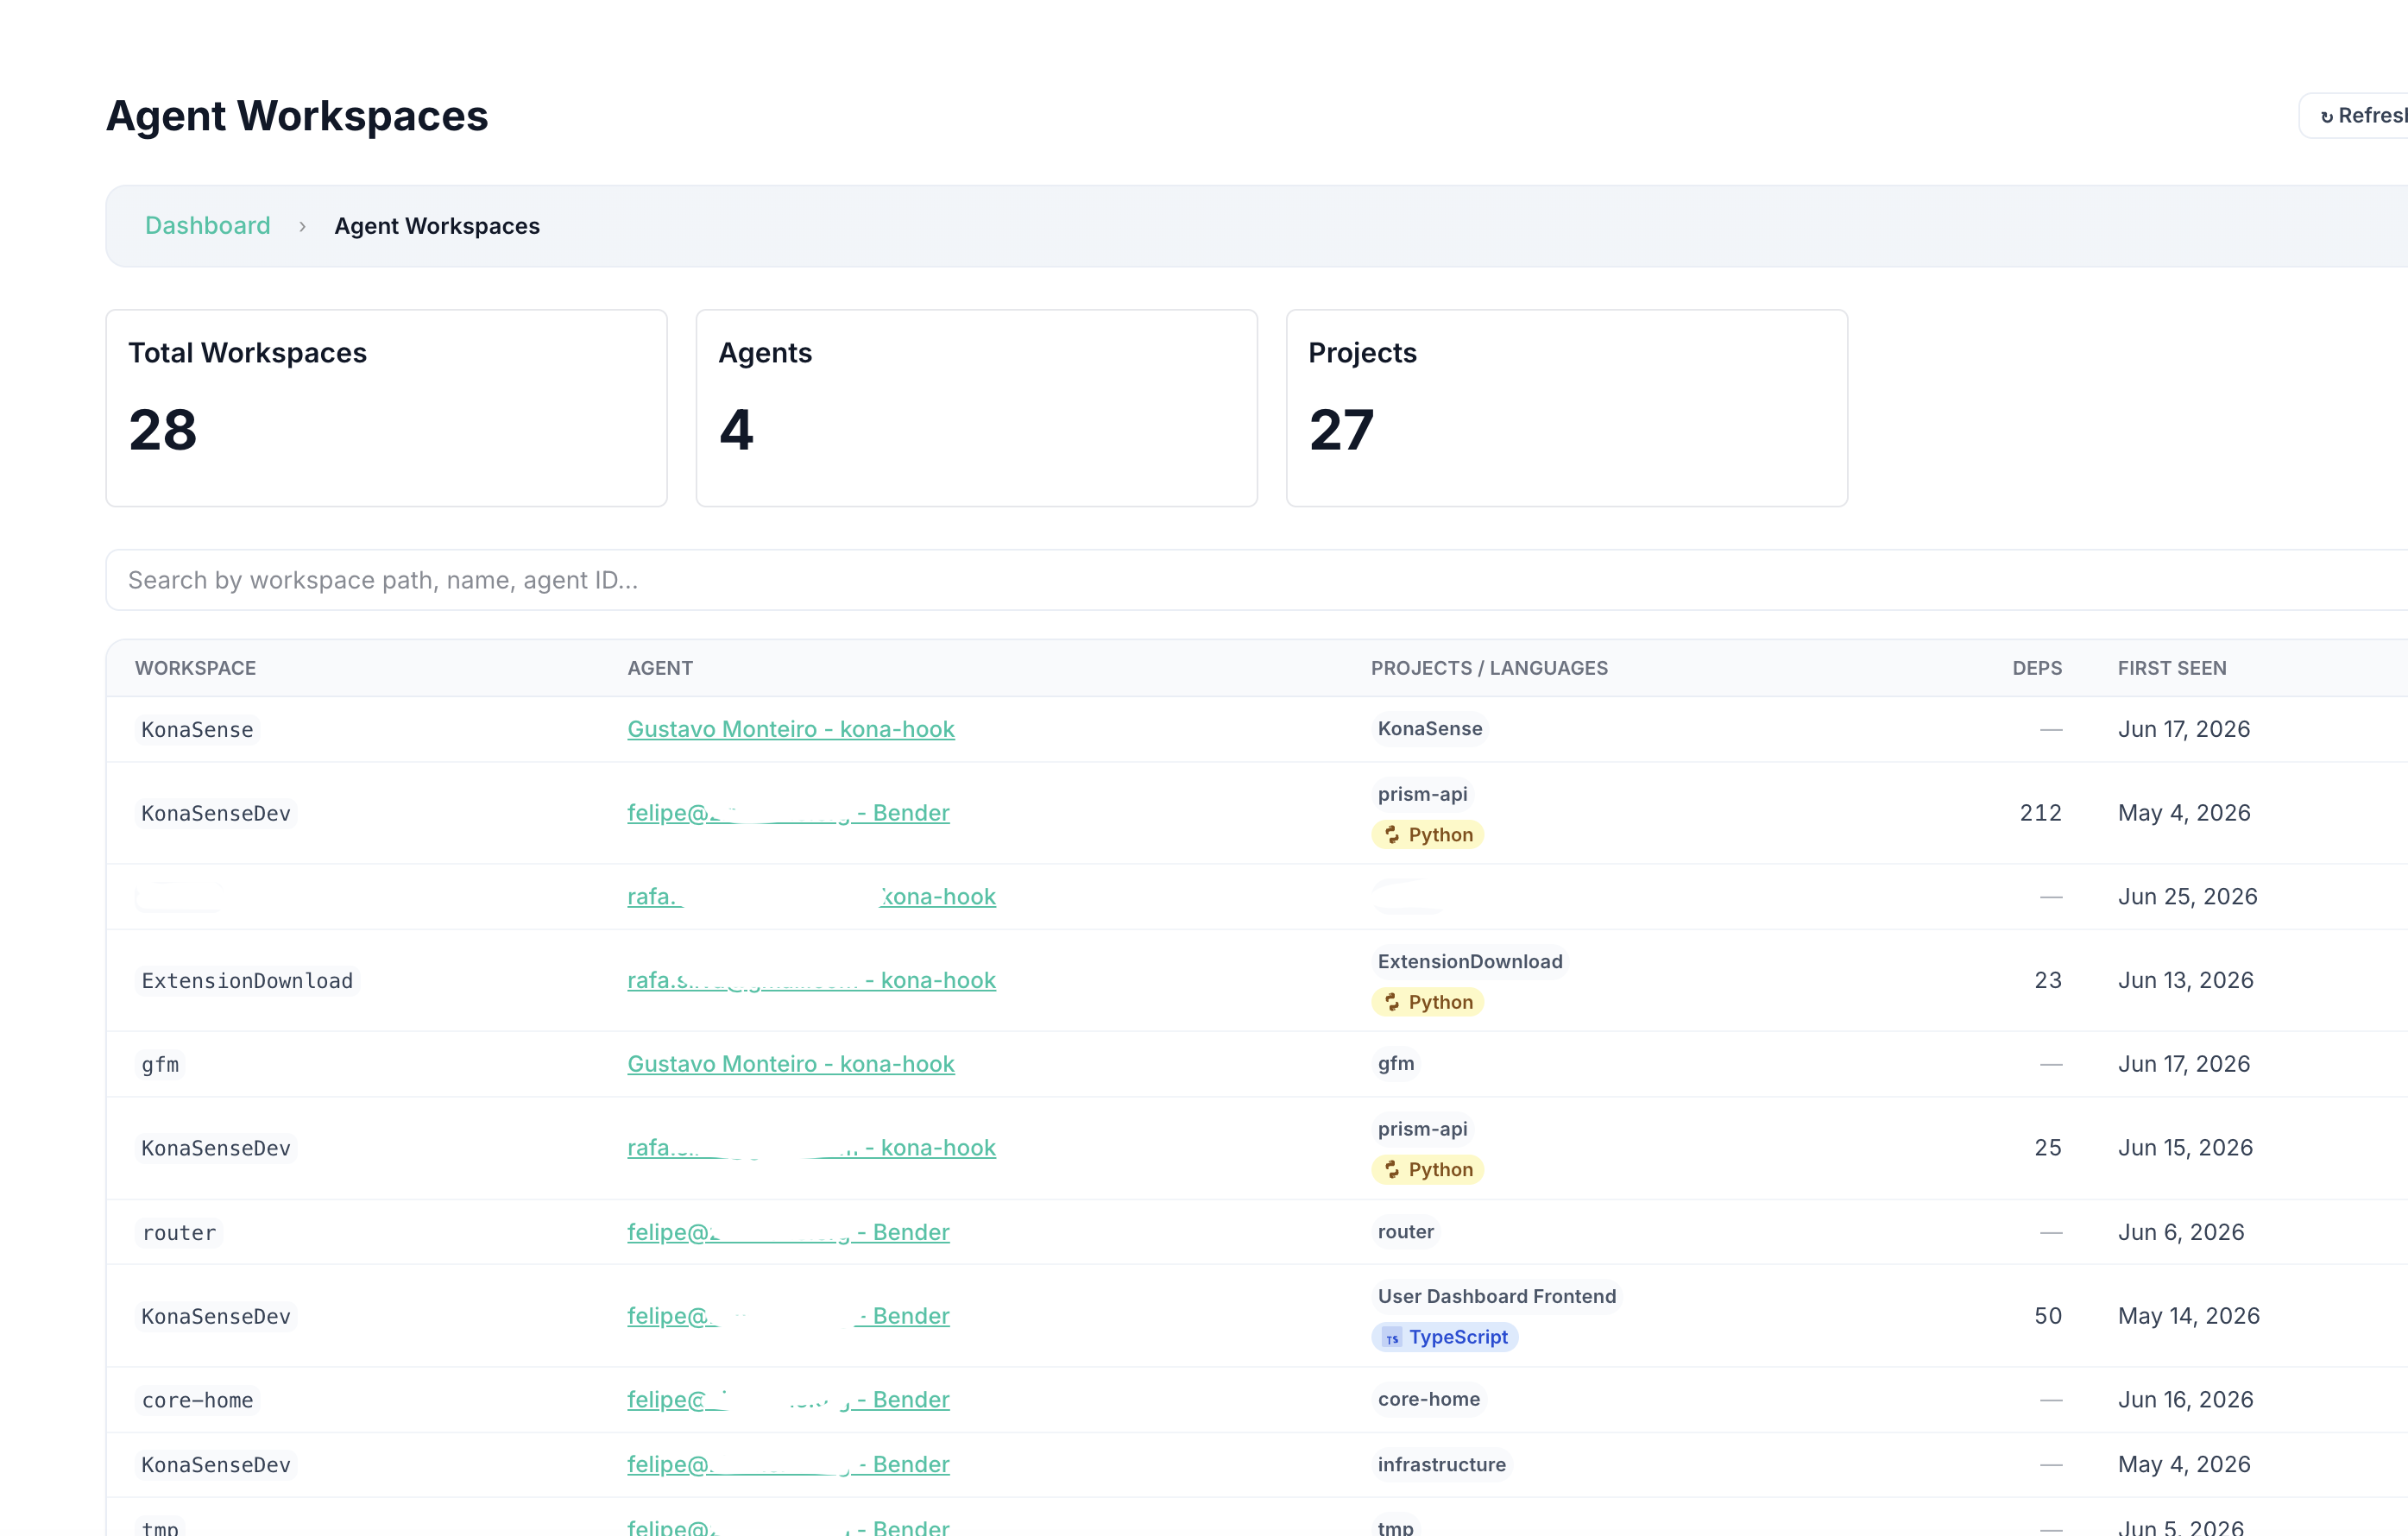
The point of this view isn't the count. It's the fact that it exists at all. Most orgs running AI coding agents today could not produce this table if asked. They'd have to go ask each engineer individually what they've been running against.
A policy engine built for agent actions, not just tools
Visibility is half the problem. The other half is control: deciding, before an agent acts, whether that action should be allowed, blocked, or escalated for human review.
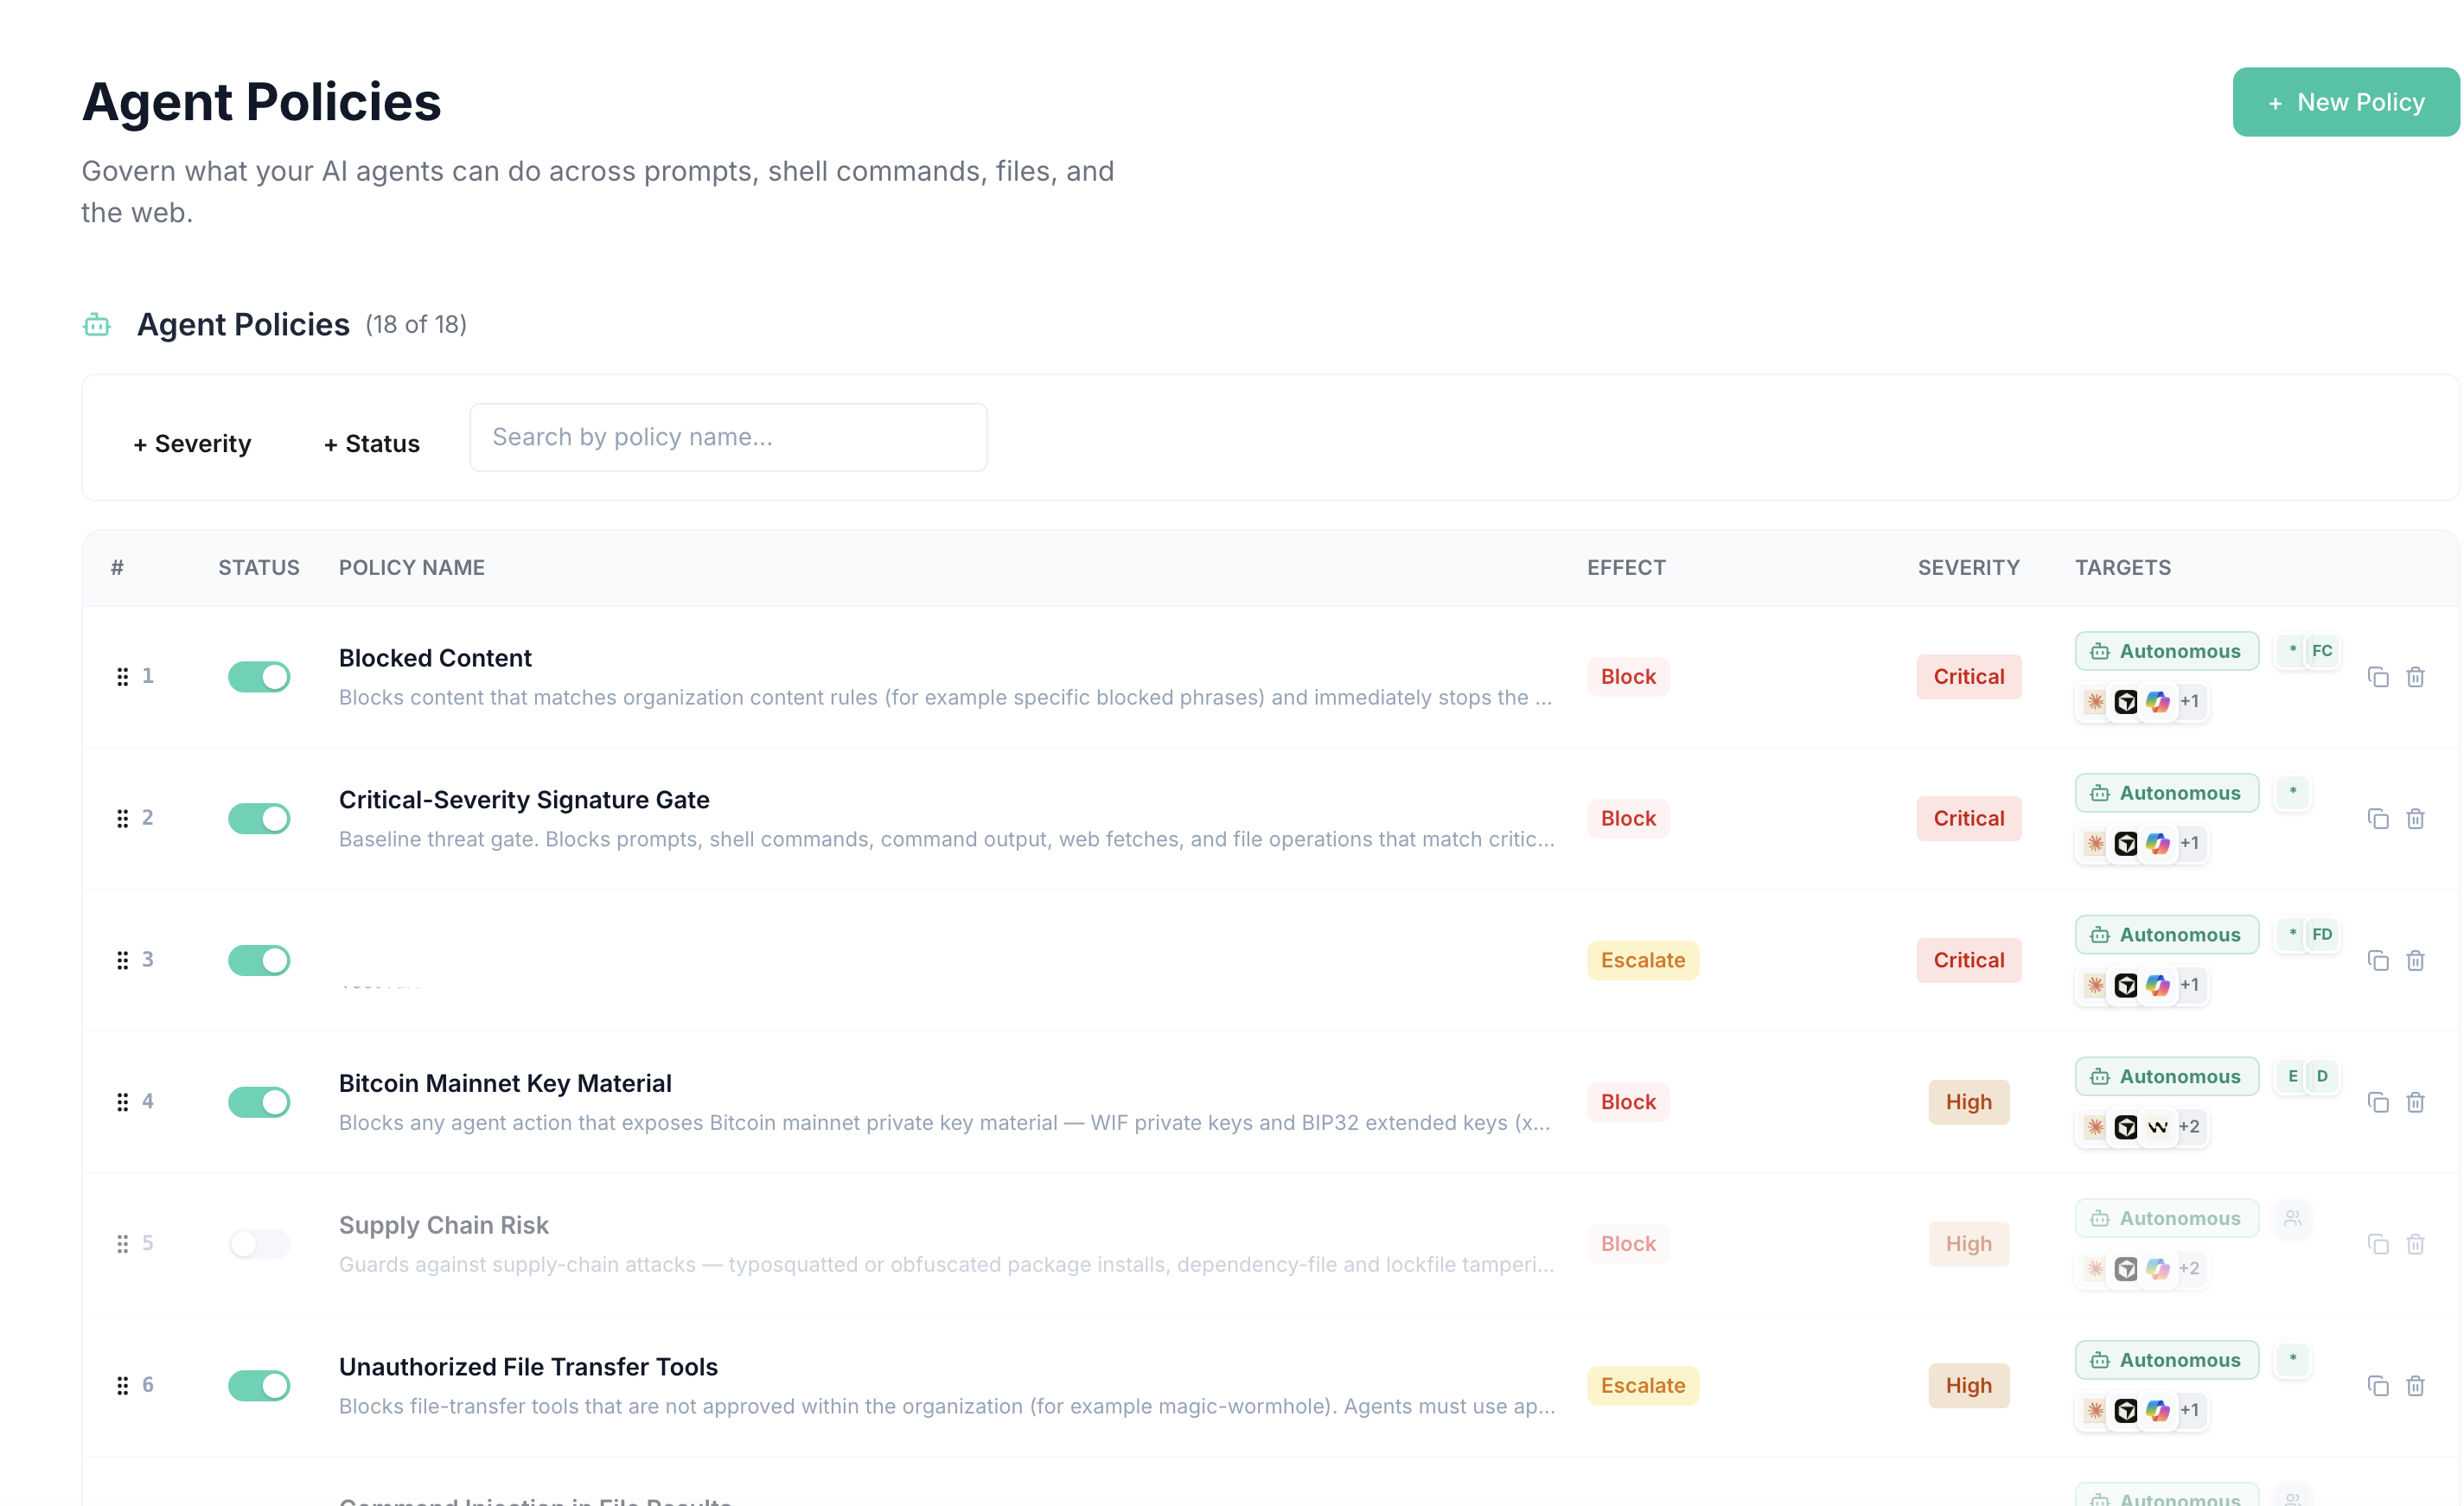
The library on this account includes rules like Blocked Content and a Critical-Severity Signature Gate as baseline threat gates, alongside more specific ones: blocking exposure of Bitcoin mainnet private key material, blocking unauthorized file-transfer tools, blocking command injection in file results, guarding credential and secret files, and blocking destructive operations against databases, filesystems, disks, git history, and cloud infrastructure. Each rule can be turned on or off independently, so the library can be tuned to what actually matters for a given org rather than applied as an all-or-nothing switch.
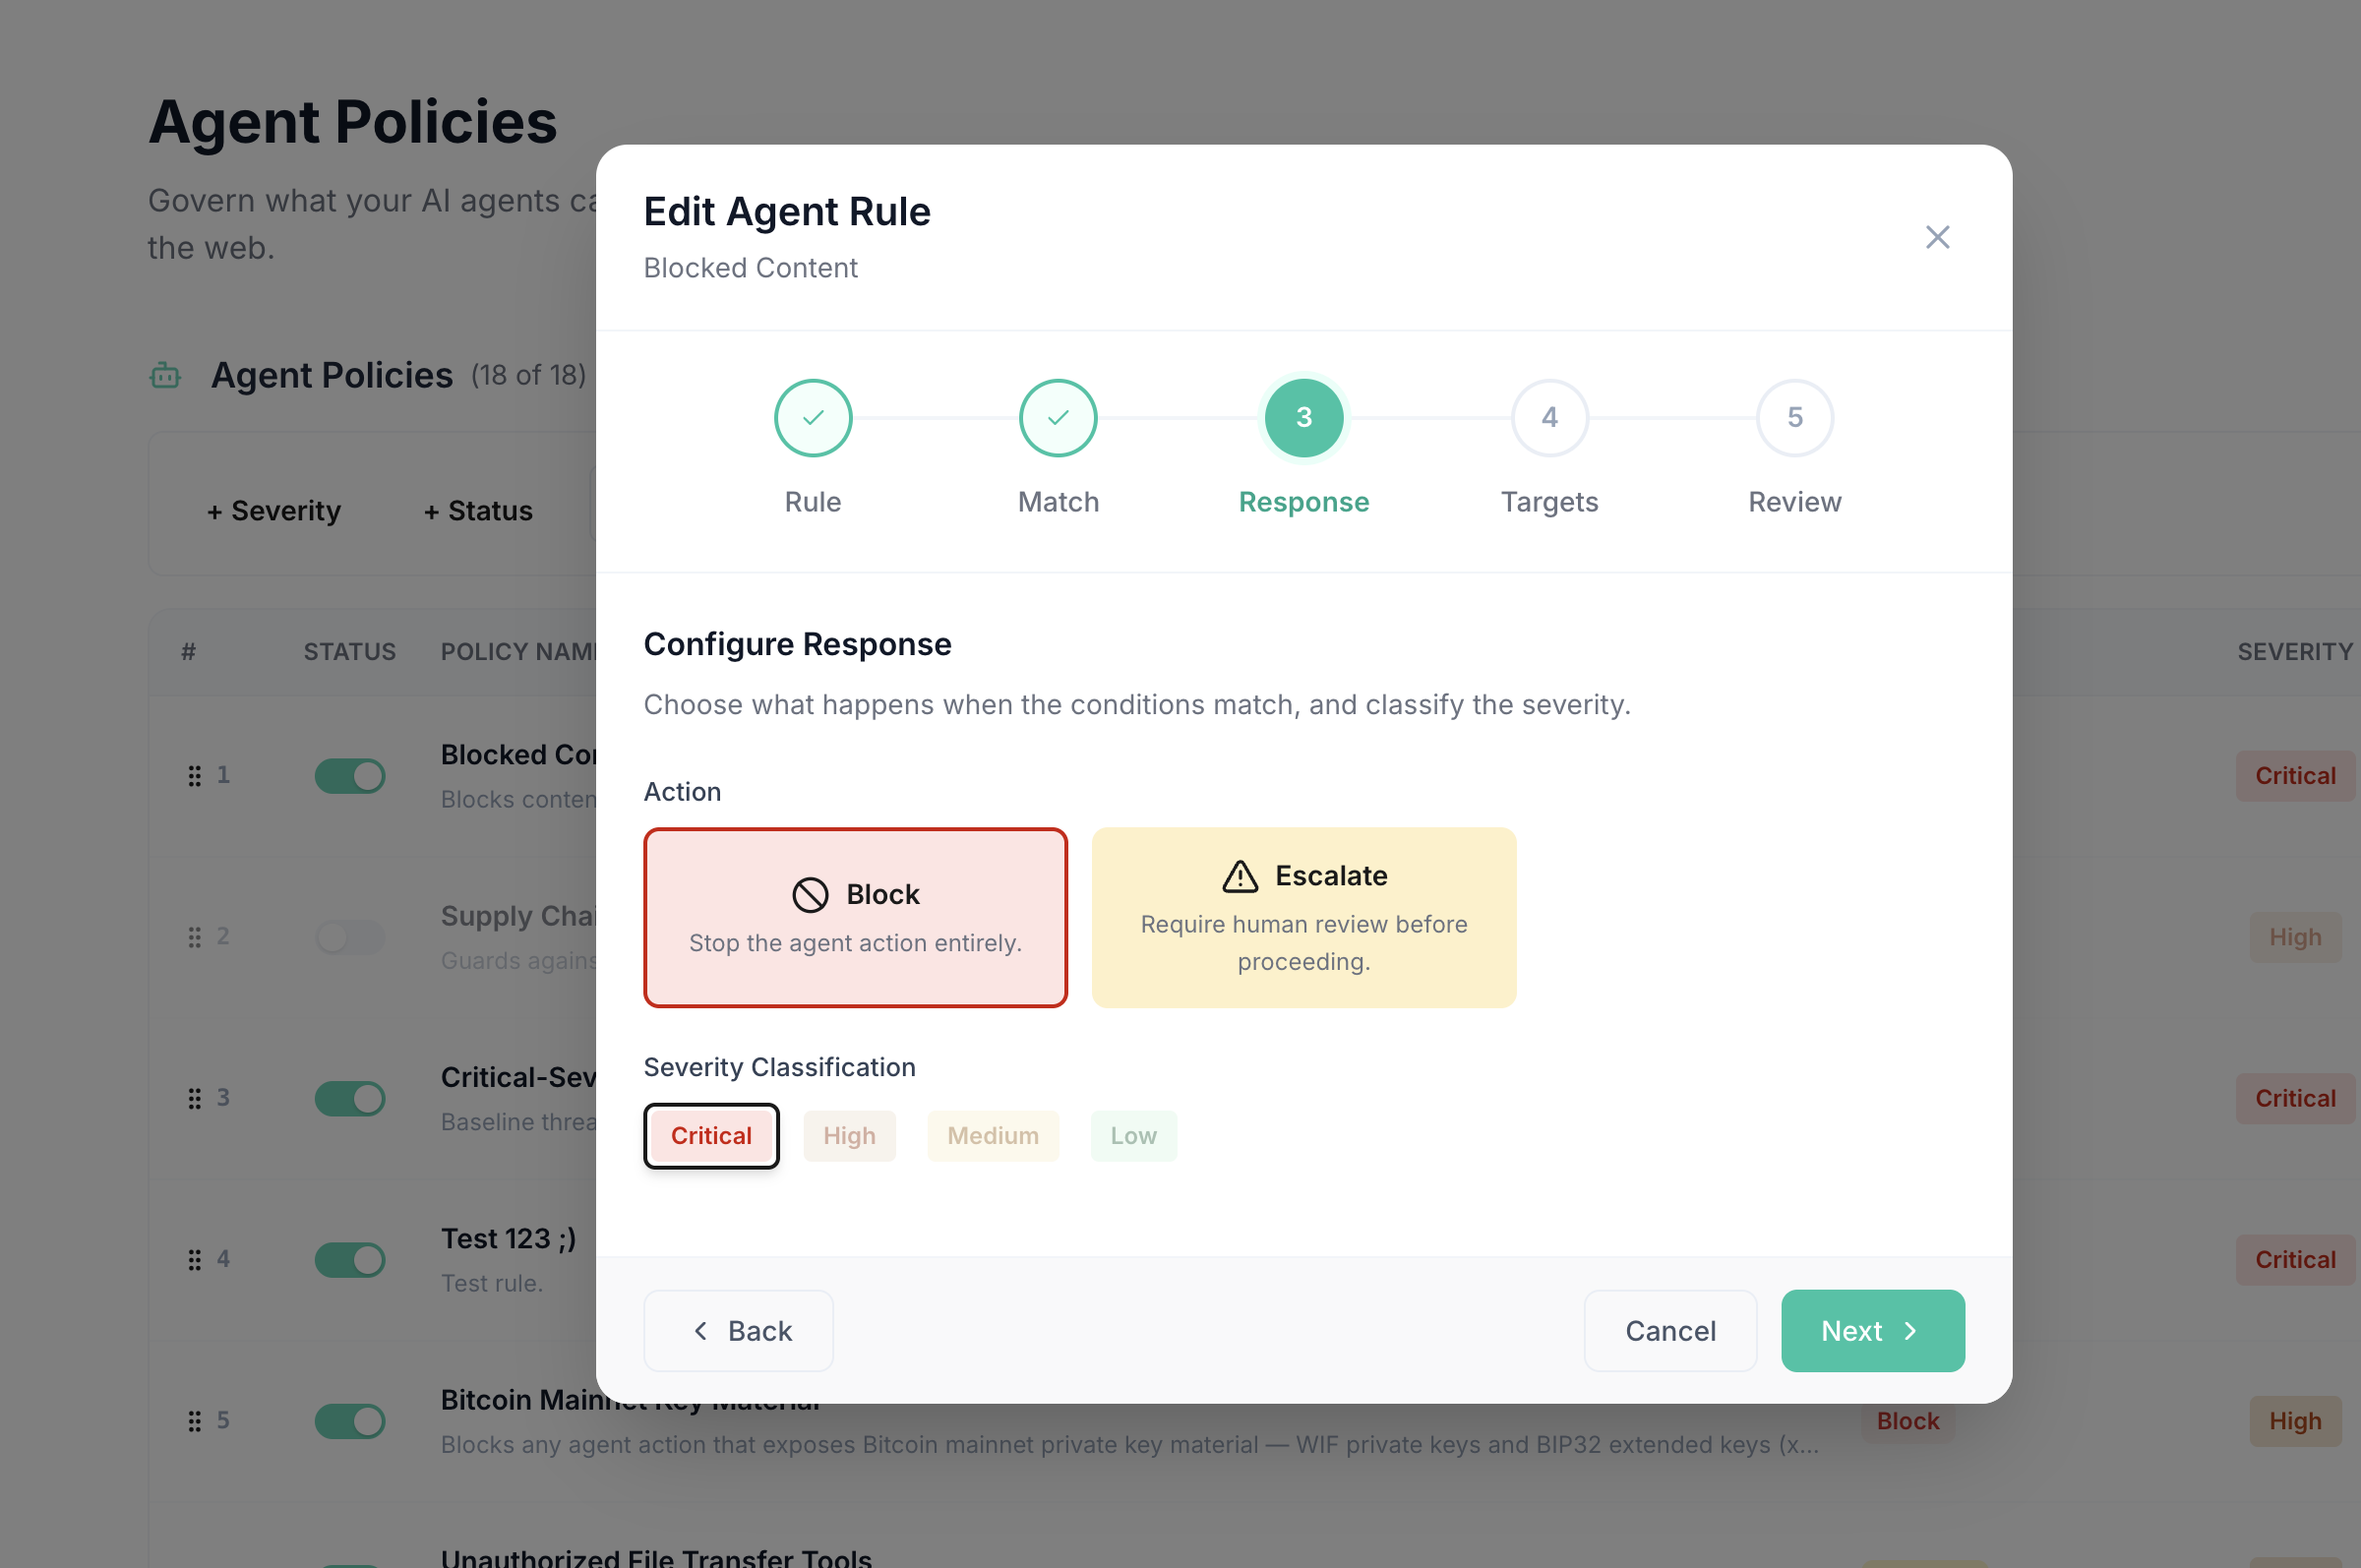
Building a rule is a five-step flow:
Match
Define the conditions: what pattern in a prompt, command, file operation, or web call triggers this rule.
Response
Choose the action when conditions match: Block stops the agent action entirely, Escalate requires human review before proceeding. Classify severity: Critical, High, Medium, or Low.
Targets
Scope the rule to specific agents, hooks, or providers rather than applying it blindly org-wide.
What this adds up to
Individually, none of these views is exotic. Execution logs, session replay, dependency mapping, and policy engines all exist elsewhere in security tooling. What's different is where they're pointed: at the agent layer, where the prompt, the tool call, and the resulting action all live in the same trace. That's the layer none of the 2020-era stack was built to see, and it's the layer where the actual risk in Parts 1 through 3 of this series originates.
You can't govern what you can't see. This is what seeing it looks like.
See this on your own agents